Plot
General description
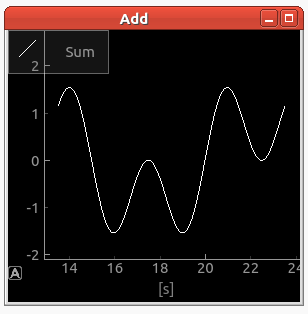
This plugin is used to signals over a time axis.
Dependencies
Optional requirements which is needed by the export feature of this plugin.
sudo apt-get install python3-pyqt5.qtsvg
Configuration
The plugin uses this specific configuration.
| Name | Type | Example | Description |
|---|---|---|---|
| x-grid | Bool | (1|0) | Enables X-Grid |
| y-grid | Bool | (1|0) | Enables Y-Grid |
| color | String | [0 1 2 3 4] | Used to set a color for the specific i-th signal. |
| style | String | [0 1 2 3 4] | Used to set a style for the specific i-th signal. |
| buffersize | Bool | 100 | Defines the buffersize. |
| downsampling_rate | Int | (1|20|100) | Used to set an internal downsampling. |
| rolling_plot | Bool | (1|0) | Start the plot as rolling plot. |
| yRange | Array | [-3.0 1.0] | Sets the y range of the plot. |
Parameter
A plugin instance can be manipulated by the following parameter.
| Name | Type | Example | Description |
|---|---|---|---|
| x-grid | Bool | (1|0) | Enables X-Grid |
| y-grid | Bool | (1|0) | Enables Y-Grid |
| color | String | [0 1 2 3 4] | Used to set a color for the specific i-th signal. |
| style | String | [0 1 2 3 4] | Used to set a style for the specific i-th signal. |
| buffersize | Bool | 100 | Defines the buffersize. |
| downsampling_rate | Int | (1|20|100) | Used to set an internal downsampling. |
| rolling | Bool | (1|0) | Start the plot as rolling plot. |
| yRange | Array | [-3.0 1.0] | Sets the y range of the plot. |